

ISO/TS 18196
(Main)Nanotechnologies — Measurement technique matrix for the characterization of nano-objects
General Information
- Abstract
This document provides a matrix that guides users to commercially available techniques relevant to the measurements of common physiochemical parameters for nano-objects. Some techniques are also applicable to nanostructured materials.
- Status
- Not Published
- Technical Committee
- ISO/TC 229 - Nanotechnologies
- Drafting Committee
- ISO/TC 229 - Nanotechnologies
- Current Stage
- 6000 - International Standard under publication
- Start Date
- 01-Sep-2026
- Completion Date
- 05-Sep-2026
Buy Documents

ISO/DTS 18196 - Nanotechnologies — Measurement technique matrix for the characterization of nano-objects
REDLINE ISO/DTS 18196 - Nanotechnologies — Measurement technique matrix for the characterization of nano-objects
Overview
ISO/TS 18196: Nanotechnologies - Measurement Technique Matrix for the Characterization of Nano-Objects is a technical specification developed by the International Organization for Standardization (ISO). This document serves as a practical guide for researchers, laboratories, and industry stakeholders to select and apply appropriate measurement techniques for the characterization of nano-objects. It presents a matrix that systematically matches commonly required physico-chemical parameters of nano-objects with a wide range of commercially available measurement techniques. Some techniques identified are also suitable for nanostructured materials, making ISO/TS 18196 an essential resource in the field of nanotechnology characterization.
Key Topics
- Nano-Object Parameters: The standard highlights key parameters such as chemical composition, concentration, crystal properties, electrokinetic potential, surface area, shape, and size distribution. These are essential for comprehensive nano-object characterization and quality control.
- Measurement Technique Matrix: At the core of ISO/TS 18196 is a Quick-Use Matrix that lists common nano-object parameters alongside an array of measurement methods. The matrix enables quick identification of which techniques are relevant for specific characterization needs.
- Coverage of Measurement Methods: Techniques included span microscopy (e.g., AFM, SEM, TEM), spectroscopy (e.g., AES, FTIR, Raman), light scattering (e.g., DLS, SLS), mass spectrometry (e.g., ICP-MS, SIMS), surface area analysis (e.g., BET), and others such as analytical centrifugation and condensation particle counting.
- Advantages and Limitations: The document addresses key advantages and limitations for each technique, helping users weigh precision, resolution, sample state requirements, and compatibility with specific nano-object parameters.
Applications
ISO/TS 18196 is widely applicable across sectors engaged in nanotechnology, research, development, and quality assurance:
- Nanomaterial R&D: Facilitates the selection of measurement technologies for fundamental research, enabling accurate comparison and reproducibility.
- Quality Control in Manufacturing: Assists manufacturers in verifying nano-object parameters to ensure batch consistency and regulatory compliance.
- Environmental and Health Monitoring: Provides the foundation to select proper measurement protocols for the detection and analysis of nanomaterials in environmental and biological samples.
- Academic and Industrial Laboratories: Supports decision-making regarding instrumentation and methodologies for routine analysis, method development, and collaborative research projects.
- Standardization and Regulatory Work: The matrix approach enhances harmonization and comparability of results across laboratories and jurisdictions in the field of nanotechnology.
Related Standards
ISO/TS 18196 references a range of related standards that users may consult for further technical detail and conformity, including:
- ISO 80004 Series: Nanotechnologies – Vocabulary
- ISO 20998-1 & ISO 20998-2: Measurement of particle size distribution by acoustic methods
- ISO 13318 Series: Methods for analytical centrifugation
- ISO 11039: Scanning probe microscopy – General rules for measurement
- ISO 16531: Surface chemical analysis – Auger electron spectroscopy (AES)
- ISO 9277: Determination of the specific surface area of solids by gas adsorption
- ISO 27891: Aerosol particle number concentrations – Calibration of condensation particle counters
For best practices, users are encouraged to consult these related ISO and ASTM standards to ensure robust and standardized measurement processes.
ISO/TS 18196 is an essential reference for efficient, accurate, and standardized characterization of nano-objects, providing a comprehensive overview of available measurement techniques and their suitability for specific nanotechnological applications. By facilitating informed decision-making, it supports advances in nanotechnology innovation, safe commercialization, and regulatory compliance.
Relations
- Consolidates
ISO 11596:2021 - Jewellery and precious metals — Sampling of precious metals and precious metal alloys - Effective Date
- 15-Jun-2024
- Effective Date
- 06-Jun-2022
Buy Documents
ISO/DTS 18196 - Nanotechnologies — Measurement technique matrix for the characterization of nano-objects
REDLINE ISO/DTS 18196 - Nanotechnologies — Measurement technique matrix for the characterization of nano-objects
Frequently Asked Questions
ISO/TS 18196 is a draft published by the International Organization for Standardization (ISO). Its full title is "Nanotechnologies — Measurement technique matrix for the characterization of nano-objects". This standard covers: This document provides a matrix that guides users to commercially available techniques relevant to the measurements of common physiochemical parameters for nano-objects. Some techniques are also applicable to nanostructured materials.
This document provides a matrix that guides users to commercially available techniques relevant to the measurements of common physiochemical parameters for nano-objects. Some techniques are also applicable to nanostructured materials.
ISO/TS 18196 is classified under the following ICS (International Classification for Standards) categories: 07.120 - Nanotechnologies. The ICS classification helps identify the subject area and facilitates finding related standards.
ISO/TS 18196 has the following relationships with other standards: It is inter standard links to ISO 11596:2021, ISO/TR 18196:2016. Understanding these relationships helps ensure you are using the most current and applicable version of the standard.
ISO/TS 18196 is available in PDF format for immediate download after purchase. The document can be added to your cart and obtained through the secure checkout process. Digital delivery ensures instant access to the complete standard document.
Standards Content (Sample)
FINAL DRAFT
Technical
Specification
ISO/DTS 18196
ISO/TC 229
Nanotechnologies — Measurement
Secretariat: BSI
technique matrix for the
Voting begins on:
characterization of nano-objects
2026-06-04
Nanotechnologies — Matrice de méthodes de mesure pour les
Voting terminates on:
nano-objets manufacturés
2026-08-27
RECIPIENTS OF THIS DRAFT ARE INVITED TO SUBMIT,
WITH THEIR COMMENTS, NOTIFICATION OF ANY
RELEVANT PATENT RIGHTS OF WHICH THEY ARE AWARE
AND TO PROVIDE SUPPOR TING DOCUMENTATION.
IN ADDITION TO THEIR EVALUATION AS
BEING ACCEPTABLE FOR INDUSTRIAL, TECHNO
ISO/CEN PARALLEL PROCESSING LOGICAL, COMMERCIAL AND USER PURPOSES, DRAFT
INTERNATIONAL STANDARDS MAY ON OCCASION HAVE
TO BE CONSIDERED IN THE LIGHT OF THEIR POTENTIAL
TO BECOME STAN DARDS TO WHICH REFERENCE MAY BE
MADE IN NATIONAL REGULATIONS.
Reference number
ISO/DTS 18196:2026(en) © ISO 2026
FINAL DRAFT
ISO/DTS 18196:2026(en)
Technical
Specification
ISO/DTS 18196
ISO/TC 229
Nanotechnologies — Measurement
Secretariat: BSI
technique matrix for the
Voting begins on:
characterization of nano-objects
Nanotechnologies — Matrice de méthodes de mesure pour les
Voting terminates on:
nano-objets manufacturés
RECIPIENTS OF THIS DRAFT ARE INVITED TO SUBMIT,
WITH THEIR COMMENTS, NOTIFICATION OF ANY
RELEVANT PATENT RIGHTS OF WHICH THEY ARE AWARE
AND TO PROVIDE SUPPOR TING DOCUMENTATION.
© ISO 2026
IN ADDITION TO THEIR EVALUATION AS
All rights reserved. Unless otherwise specified, or required in the context of its implementation, no part of this publication may
BEING ACCEPTABLE FOR INDUSTRIAL, TECHNO
ISO/CEN PARALLEL PROCESSING
LOGICAL, COMMERCIAL AND USER PURPOSES, DRAFT
be reproduced or utilized otherwise in any form or by any means, electronic or mechanical, including photocopying, or posting on
INTERNATIONAL STANDARDS MAY ON OCCASION HAVE
the internet or an intranet, without prior written permission. Permission can be requested from either ISO at the address below
TO BE CONSIDERED IN THE LIGHT OF THEIR POTENTIAL
or ISO’s member body in the country of the requester.
TO BECOME STAN DARDS TO WHICH REFERENCE MAY BE
MADE IN NATIONAL REGULATIONS.
ISO copyright office
CP 401 • Ch. de Blandonnet 8
CH-1214 Vernier, Geneva
Phone: +41 22 749 01 11
Email: copyright@iso.org
Website: www.iso.org
Published in Switzerland Reference number
ISO/DTS 18196:2026(en) © ISO 2026
ii
ISO/DTS 18196:2026(en)
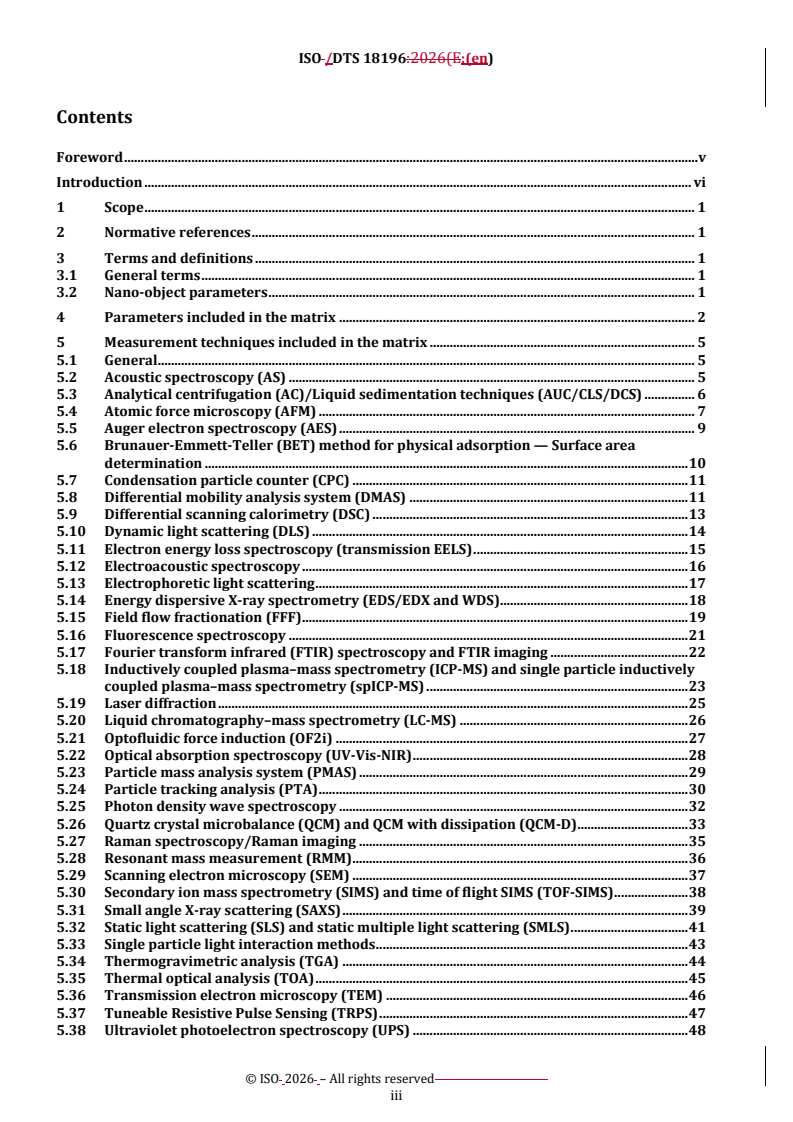
Contents Page
Foreword .viii
Introduction .ix
1 Scope . 1
2 Normative references . 1
3 Terms and definitions . 1
3.1 General terms .1
3.2 Nano-object parameters .1
4 Parameters included in the matrix . 2
5 Measurement techniques included in the matrix . 4
5.1 General .4
5.2 Acoustic spectroscopy (AS) .5
5.2.1 Description .5
5.2.2 Nano-object parameters .5
5.2.3 Advantages .5
5.2.4 Limitations .5
5.2.5 Measurand .5
5.2.6 Relevant standards .6
5.3 Analytical centrifugation (AC)/Liquid sedimentation techniques (AUC/CLS/DCS) .6
5.3.1 Description .6
5.3.2 Nano-object parameters .6
5.3.3 Advantages .6
5.3.4 Limitations .6
5.3.5 Measurand .6
5.3.6 Relevant standards .7
5.4 Atomic force microscopy (AFM) .7
5.4.1 Description .7
5.4.2 Nano-object parameters .7
5.4.3 Advantages .7
5.4.4 Limitations .7
5.4.5 Measurand .8
5.4.6 Relevant standards .8
5.5 Auger electron spectroscopy (AES) .8
5.5.1 Description .8
5.5.2 Nano-object parameters .8
5.5.3 Advantages .8
5.5.4 Limitations .8
5.5.5 Measurand .8
5.5.6 Relevant standards .9
5.6 Brunauer-Emmett-Teller (BET) method for physical adsorption — Surface area
determination . . .9
5.6.1 Description .9
5.6.2 Nano-object parameters .9
5.6.3 Advantages .9
5.6.4 Limitations .9
5.6.5 Measurand .9
5.6.6 Relevant standards .9
5.7 Condensation particle counter (CPC) .10
5.7.1 Description .10
5.7.2 Nano-object parameters .10
5.7.3 Advantages .10
5.7.4 Limitations .10
5.7.5 Measurand .10
5.7.6 Relevant standards .10
iii
ISO/DTS 18196:2026(en)
5.8 Differential mobility analysis system (DMAS) .10
5.8.1 Description .10
5.8.2 Nano-object parameters .11
5.8.3 Advantages .11
5.8.4 Limitations .11
5.8.5 Measurand .11
5.8.6 Relevant standards .11
5.9 Differential scanning calorimetry (DSC) . 12
5.9.1 Description . 12
5.9.2 Nano-object parameters . 12
5.9.3 Advantages . 12
5.9.4 Limitations . 12
5.9.5 Measurand . 12
5.9.6 Relevant standards . 12
5.10 Dynamic light scattering (DLS) . 12
5.10.1 Description . 12
5.10.2 Nano-object parameters . 13
5.10.3 Advantages . 13
5.10.4 Limitations . 13
5.10.5 Measurand .14
5.10.6 Relevant standards .14
5.11 Electron energy loss spectroscopy (transmission EELS) .14
5.11.1 Description .14
5.11.2 Nano-object parameters .14
5.11.3 Advantages .14
5.11.4 Limitations . 15
5.11.5 Measurand . 15
5.11.6 Relevant standards . 15
5.12 Electroacoustic spectroscopy . 15
5.12.1 Description . 15
5.12.2 Nano-object parameters . 15
5.12.3 Advantages . 15
5.12.4 Limitations .16
5.12.5 Measurand .16
5.12.6 Relevant standards .16
5.13 Electrophoretic light scattering .16
5.13.1 Description .16
5.13.2 Nano-object parameters .16
5.13.3 Advantages .16
5.13.4 Limitations .16
5.13.5 Measurands .17
5.13.6 Relevant standards .17
5.14 Energy dispersive X-ray spectrometry (EDS/EDX and WDS) .17
5.14.1 Description .17
5.14.2 Nano-object parameters .17
5.14.3 Advantages .17
5.14.4 Limitations .17
5.14.5 Measurand .17
5.14.6 Relevant standards .17
5.15 Field flow fractionation (FFF) .18
5.15.1 Description .18
5.15.2 Nano-object parameters .18
5.15.3 Advantages .18
5.15.4 Limitations .18
5.15.5 Measurand .19
5.15.6 Relevant standards .19
5.16 Fluorescence spectroscopy .19
5.16.1 Description .19
5.16.2 Nano-object parameters .19
iv
ISO/DTS 18196:2026(en)
5.16.3 Advantages .19
5.16.4 Limitations .19
5.16.5 Measurand . 20
5.16.6 Relevant standards . 20
5.17 Fourier transform infrared (FTIR) spectroscopy and FTIR imaging . 20
5.17.1 Description . 20
5.17.2 Nano-object parameters . 20
5.17.3 Advantages . 20
5.17.4 Limitations . 20
5.17.5 Measurand .21
5.17.6 Relevant standards .21
5.18 Inductively coupled plasma–mass spectrometry (ICP-MS) and single particle
inductively coupled plasma–mass spectrometry (spICP-MS) .21
5.18.1 Description .21
5.18.2 Nano-object parameters .21
5.18.3 Advantages .21
5.18.4 Limitations . 22
5.18.5 Measurand . 22
5.18.6 Relevant standards . 22
5.19 Laser diffraction . 22
5.19.1 Description . 22
5.19.2 Nano-object parameters . 23
5.19.3 Advantages . 23
5.19.4 Limitations . 23
5.19.5 Measurand . 23
5.19.6 Relevant standards . 23
5.20 Liquid chromatography–mass spectrometry (LC-MS) . 23
5.20.1 Description . 23
5.20.2 Nano-object parameters . 23
5.20.3 Advantages .24
5.20.4 Limitations .24
5.20.5 Measurand .24
5.20.6 Relevant standards .24
5.21 Optofluidic force induction (OF2i) .24
5.21.1 Description .24
5.21.2 Nano -object parameters.24
5.21.3 Advantages .24
5.21.4 Limitations . 25
5.21.5 Measurands . 25
5.21.6 Relevant standards . 25
5.22 Optical absorption spectroscopy (UV-Vis-NIR). 25
5.22.1 Description . 25
5.22.2 Nano-object parameters . 26
5.22.3 Advantages . 26
5.22.4 Limitations . 26
5.22.5 Measurand . 26
5.22.6 Relevant standards . 26
5.23 Particle mass analysis system (PMAS) . 26
5.23.1 Description . 26
5.23.2 Nano-object parameters .27
5.23.3 Advantages .27
5.23.4 Limitations .27
5.23.5 Measurand .27
5.23.6 Relevant standards .27
5.24 Particle tracking analysis (PTA) .27
5.24.1 Description .27
5.24.2 Nano-object parameters . 28
5.24.3 Advantages . 28
5.24.4 Limitations . 29
v
ISO/DTS 18196:2026(en)
5.24.5 Measurand . 29
5.24.6 Relevant standards . 29
5.25 Photon density wave spectroscopy . 29
5.25.1 Description . 29
5.25.2 Nano-object parameters . 30
5.25.3 Advantages . 30
5.25.4 Limitations . 30
5.25.5 Measurand . 30
5.25.6 Relevant standards .31
5.26 Quartz crystal microbalance (QCM) and QCM with dissipation (QCM-D).31
5.26.1 Description .31
5.26.2 Nano-object parameters .31
5.26.3 Advantages .31
5.26.4 Limitations .31
5.26.5 Measurand .31
5.26.6 Relevant standards .32
5.27 Raman spectroscopy/Raman imaging .32
5.27.1 Description .32
5.27.2 Nano-object parameters .32
5.27.3 Advantages .32
5.27.4 Limitations .32
5.27.5 Measurand . 33
5.27.6 Relevant standards for Raman . 33
5.28 Resonant mass measurement (RMM) . 33
5.28.1 Description . 33
5.28.2 Nano-object parameters . 33
5.28.3 Advantages . 33
5.28.4 Limitations . 33
5.28.5 Measurand . 33
5.28.6 Relevant standards . 33
5.29 Scanning electron microscopy (SEM) . 33
5.29.1 Description . 33
5.29.2 Nano-object parameters . 34
5.29.3 Advantages . 34
5.29.4 Limitations . 34
5.29.5 Measurand . 35
5.29.6 Relevant standards . 35
5.30 Secondary ion mass spectrometry (SIMS) and time of flight SIMS (TOF-SIMS) . 35
5.30.1 Description . 35
5.30.2 Nano-object parameters . 35
5.30.3 SIMS Advantages . 35
5.30.4 SIMS and TOF-SIMS limitations . . 36
5.30.5 Measurand . 36
5.30.6 Relevant standards .
...
ISO/DTS 18196:2026(E)
ISO /TC 229/JWG 2
Secretariat: BSI
Date: 2026-05-20
Nanotechnologies — Measurement technique matrix for the
characterization of nano-objects
Nanotechnologies — Matrice de méthodes de mesure pour les nano-objets manufacturés
DTS stage
Warning for WDs and CDs
This document is not an ISO International Standard. It is distributed for review and comment. It is subject to change
without notice and may not be referred to as an International Standard.
Recipients of this draft are invited to submit, with their comments, notification of any relevant patent rights of which
TThhiis drs draafftt i is s susubbmmiitttteed d ttoo aa ppaarraallellel l vvoottee i inn IISSOO,, CCEEN.N.
they are aware and to provide supporting documentation.
ISO /DTS 18196:2026(E:(en)
All rights reserved. Unless otherwise specified, or required in the context of its implementation, no part of this publication
may be reproduced or utilized otherwise in any form or by any means, electronic or mechanical, including photocopying,
or posting on the internet or an intranet, without prior written permission. Permission can be requested from either ISO
at the address below or ISO’s member body in the country of the requester.
ISO copyright office
CP 401 • Ch. de Blandonnet 8
CH-1214 Vernier, Geneva
Phone: + 41 22 749 01 11
EmailE-mail: copyright@iso.org
Website: www.iso.orgwww.iso.org
Published in Switzerland
© ISO 2026 – All rights reserved
ii
ISO /DTS 18196:2026(E:(en)
Contents
Foreword . v
Introduction . vi
1 Scope . 1
2 Normative references . 1
3 Terms and definitions . 1
3.1 General terms . 1
3.2 Nano-object parameters . 1
4 Parameters included in the matrix . 2
5 Measurement techniques included in the matrix . 5
5.1 General . 5
5.2 Acoustic spectroscopy (AS) . 5
5.3 Analytical centrifugation (AC)/Liquid sedimentation techniques (AUC/CLS/DCS) . 6
5.4 Atomic force microscopy (AFM) . 7
5.5 Auger electron spectroscopy (AES) . 9
5.6 Brunauer-Emmett-Teller (BET) method for physical adsorption — Surface area
determination . 10
5.7 Condensation particle counter (CPC) . 11
5.8 Differential mobility analysis system (DMAS) . 11
5.9 Differential scanning calorimetry (DSC) . 13
5.10 Dynamic light scattering (DLS) . 14
5.11 Electron energy loss spectroscopy (transmission EELS) . 15
5.12 Electroacoustic spectroscopy . 16
5.13 Electrophoretic light scattering . 17
5.14 Energy dispersive X-ray spectrometry (EDS/EDX and WDS) . 18
5.15 Field flow fractionation (FFF) . 19
5.16 Fluorescence spectroscopy . 21
5.17 Fourier transform infrared (FTIR) spectroscopy and FTIR imaging . 22
5.18 Inductively coupled plasma–mass spectrometry (ICP-MS) and single particle inductively
coupled plasma–mass spectrometry (spICP-MS) . 23
5.19 Laser diffraction . 25
5.20 Liquid chromatography–mass spectrometry (LC-MS) . 26
5.21 Optofluidic force induction (OF2i) . 27
5.22 Optical absorption spectroscopy (UV-Vis-NIR) . 28
5.23 Particle mass analysis system (PMAS) . 29
5.24 Particle tracking analysis (PTA) . 30
5.25 Photon density wave spectroscopy . 32
5.26 Quartz crystal microbalance (QCM) and QCM with dissipation (QCM-D). 33
5.27 Raman spectroscopy/Raman imaging . 35
5.28 Resonant mass measurement (RMM) . 36
5.29 Scanning electron microscopy (SEM) . 37
5.30 Secondary ion mass spectrometry (SIMS) and time of flight SIMS (TOF-SIMS) . 38
5.31 Small angle X-ray scattering (SAXS) . 39
5.32 Static light scattering (SLS) and static multiple light scattering (SMLS) . 41
5.33 Single particle light interaction methods . 43
5.34 Thermogravimetric analysis (TGA) . 44
5.35 Thermal optical analysis (TOA) . 45
5.36 Transmission electron microscopy (TEM) . 46
5.37 Tuneable Resistive Pulse Sensing (TRPS) . 47
5.38 Ultraviolet photoelectron spectroscopy (UPS) . 48
© ISO 2026 – All rights reserved
iii
ISO /DTS 18196:2026(E:(en)
5.39 X-ray diffraction (XRD) . 49
5.40 X-ray photoelectron spectroscopy (XPS) . 50
Bibliography . 52
© ISO 2026 – All rights reserved
iv
ISO /DTS 18196:2026(E:(en)
Foreword
ISO (the International Organization for Standardization) is a worldwide federation of national standards
bodies (ISO member bodies). The work of preparing International Standards is normally carried out through
ISO technical committees. Each member body interested in a subject for which a technical committee has been
established has the right to be represented on that committee. International organizations, governmental and
non-governmental, in liaison with ISO, also take part in the work. ISO collaborates closely with the
International Electrotechnical Commission (IEC) on all matters of electrotechnical standardization.
The procedures used to develop this document and those intended for its further maintenance are described
in the ISO/IEC Directives, Part 1. In particular, the different approval criteria needed for the different types of
ISO documents should be noted. This document was drafted in accordance with the editorial rules of the
ISO/IEC Directives, Part 2 (see www.iso.org/directives).
Attention is drawn to the possibility that some of the elements of this document may be the subject of patent
rights. ISO shall not be held responsible for identifying any or all such patent rights. Details of any patent rights
identified during the development of the document will be in the Introduction and/or on the ISO list of patent
declarations received (see www.iso.org/patents).
Any trade name used in this document is information given for the convenience of users and does not
constitute an endorsement.
For an explanation of the voluntary nature of standards, the meaning of ISO specific terms and expressions
related to conformity assessment, as well as information about ISO's adherence to the World Trade
Organization (WTO) principles in the Technical Barriers to Trade (TBT), see www.iso.org/iso/foreword.html.
This document was prepared by Technical Committee ISO/TC 229, Nanotechnologies, in collaboration with
the European Committee for Standardization (CEN) Technical Committee CEN/TC 352, Nanotechnologies, in
accordance with the Agreement on technical cooperation between ISO and CEN (Vienna Agreement).
This first edition of ISO/TS 18196:2026 cancels and replaces ISO/TR 18196:2016, which has been revised.
The main changes are as follows:
— Additionaddition of further measurement techniques;
— Updatingrevision of terms and definitions;
— Updatingrevision of references.
Any feedback or questions on this document should be directed to the user’s national standards body. A
complete listing of these bodies can be found at www.iso.org/members.htmlwww.iso.org/members.html.
© ISO 2026 – All rights reserved
v
ISO /DTS 18196:2026(E:(en)
Introduction
This document connects the nano-object parameters that most commonly need to be measured with
corresponding measurement techniques. This document is useful for nanotechnology interested parties to
rapidly identify relevant information for measuring nano-objects. The common nano-object parameters are
listed along the top row of the Quick-Use-Matrix (see Table 1Table 1).). If a measurement technique listed in
the first column of the matrix is applicable, the box in the matrix will be marked. Once a measurement
technique of interest is identified, it is suggested that the reader then enters this document’s body of text (see
Clause 5Clause 5),), where youthey will find an alphabetical listing of the measurement techniques and
descriptions of the advantages, limitations, relevant standards, measurand(s), and applicable nano-object
parameters of each technique.
As scientific advances are made and additional commercial measurement techniques become available, this
document will be periodically reviewed and updated to maintain its relevance.
Many of the techniques listed in this document have not been validated through interlaboratory comparisons
or any other means for the measurement of nano-objects. This document is intended as a starting point and
resource to help identify potentially useful and relevant techniques; it is not an exhaustive or primary source.
Once a technique has been identified, the reader must refer to relevant international standards and conduct a
literature search for similar or comparable applications. Other sources of information include instrument
manufacturer’s applications notes and technical literature.
© ISO 2026 – All rights reserved
vi
ISO /DTS 18196:2026(E:(en)
Nanotechnologies — Measurement technique matrix for the
characterization of nano-objects
1 1 Scope
This document provides a matrix that guides users to commercially available techniques relevant to the
measurements of common physiochemical parameters for nano-objects. Some techniques are also applicable
to nanostructured materials.
2 2 Normative references
There are no normative references in this document.
3 The following documents are referred to in the text in such a way that some or all of their content constitutes
requirements of this document. For dated references, only the edition cited applies. For undated references,
the latest edition of the referenced document (including any amendments) applies.
ISO 80004 series, Nanotechnologies — Vocabulary
3 Terms and definitions
For the purposes of this document, the terms and definitions given in the ISO 80004-X series of publications
and the following apply.
ISO and IEC maintain terminological databases for use in standardization at the following addresses:
— — IEC Electropedia: available at https://www.electropedia.org/
— — ISO Online browsing platform: available at https://www.iso.org/obp
3.1 General terms
3.1.1 3.1.1
dispersion
heterogeneous system in which a finely divided material is distributed in another material
[SOURCE: ISO 472:2013, 2.288]
3.1.2 3.1.2
measurand
quantity intended to be measured
[SOURCE: ISO/IEC Guide 99:2007, 2.3]
3.2 3.2 Nano-object parameters
3.2.1 3.2.1
chemical composition
identity and possible quantification of a material’s composite parts and its impurities
3.2.2 3.2.2
concentration
content of nano-objects in a sample, quantified as number, area, volume, mole, or mass content
© ISO 2026 – All rights reserved
ISO /DTS 18196:2026(E:(en)
Note 1 to entry: Transformation calculation from one type of quantity to another (e.g. number to volume) requires the
knowledge of the complete particle size distribution and the assumption of a size-independent shape, porosity or
[3] [3]
density .
3.2.3 3.2.3
crystal property
effect due to the presence of three-dimensional order at the level of molecular dimensions
3.2.4 3.2.4
electrokinetic potential
difference in electric potential between that at the slipping plane and that of the bulk liquid
Note 1 to entry: Electrokinetic potential is expressed in volts.
Note 2 to entry: Often called “zeta potential”.
[SOURCE: ISO 13099-1:20212012, 2.1.8]
3.2.5 3.2.5
surface area
area of the external surface of a solid plus the internal surface of its accessible macro-, meso- and micropores
Note 1 to entry: Surface area is the quantity of accessible surface of a sample when exposed to either gaseous or liquid
adsorbate phase. Surface area is conventionally expressed as a mass-specific surface area or as volume-specific surface
[6] [6]
area where the total quantity of area has been normalized either to the sample’s mass or volume .
[SOURCE: ISO 9277:2022, 3.10]
4 Parameters included in the matrix
Several comprehensive literature searches, input from ISO/TC 229 experts, and a review of current ISO
workInternational Standards have identified frequently sought nano-object parameters that are listed across
the top of the Quick-Use-Matrix (see Table 1Table 1). ). The parameters listed from left to right are in
alphabetical order. A single technique alone often cannot provide sufficient information about all parameters
of interest for a particular nano-object under study, nor is one technique likely to fully capture relevant
information for a single parameter. Therefore, when available, it is recommended that more than one
technique should be used for any parameter investigation.
© ISO 2026 – All rights reserved
ISO /DTS 18196:2026(E:(en)
[[7][7]]
Table 1 — Quick-Use-Matrix
Technique
Electro
Chemical Crystal Size
Concen kinetic Surface
Acronym compositi propert Shape Size distrib
tration potenti area
on ies ution
al
Acoustic
AS + + +
spectroscopy
Analytical
AC/CLS/A
centrifugation/Liqui + + +
UC/DCS
d sedimentation
Particle mass
PMAS + +
analysis system
Auger electron
spectroscopy AES + + + +
(scanning)
Brunauer-Emmett-
BET +
Teller
Condensation
CPC +
particle counter
Differential mobility
DMAS + + +
a
analysis system
Differential
scanning DSC +
calorimetry
Dynamic light
DLS + +
b
scattering
Electroacoustic
EAS +
spectroscopy
Electron energy loss
EELS +
a
spectroscopy
Electrophoretic
+
light scattering
EM based X-ray EDX/EDS/
+
a
spectrometry WDS
Field flow
FFF + + + +
a
fractionation
Fluorescence
+
spectroscopy
Fourier transform
infrared
FTIR +
spectroscopy/
imaging
Induced grating
IG + +
method
© ISO 2026 – All rights reserved
ISO /DTS 18196:2026(E:(en)
Technique
Electro
Chemical Crystal Size
Concen kinetic Surface
Acronym compositi propert Shape Size distrib
tration potenti area
on ies ution
al
Inductively coupled
plasma–mass
spectrometry and ICP-MS + + + +
single particle
ICP-MS
b
Laser diffraction LD + +
Liquid
chromatography–
LC-MS + +
mass
spectrometry
Particle tracking
PTA + + + +
analysis
Optical absorption UV/Vis/NI
+ + +
spectroscopy R
Optofluidic Force
OF2i + + + +
Induction
Photon Density
Wave
Spectroscopydensit PDWS + + +
y wave
spectroscopy
Quartz
QCM +
microbalances
Raman
spectroscopy/ + +
imaging
Resonant mass
RMM + +
measurement
Scanning electron
SEM + + + + +
a
microscopy
Scanning probe SPM/AFM/
+ + +
microscopy STM
Secondary ion mass
SIMS +
spectrometry
Small angle X-ray
SAXS + + + + +
scattering
Static light
SLS/SMLS + +
b
scattering
Single particle light
interaction + + +
b
methods
Thermal optical
TOA +
analysis
© ISO 2026 – All rights reserved
ISO /DTS 18196:2026(E:(en)
Technique
Electro
Chemical Crystal Size
Concen kinetic Surface
Acronym compositi propert Shape Size distrib
tration potenti area
on ies ution
al
Thermogravimetric
TGA +
analysis
Transmission
electron TEM + + + + +
a
microscopy
Tuneable resistive
TRPS + + + +
pulse sensing
X-ray diffraction XRD + +
X-ray photoelectron
XPS + +
spectroscopy
a Requires a special detector or additional instrumentation to obtain the desired parameter.
b Light scattering technique.
5 Measurement techniques included in the matrix
5.1 General
In the following subclauses, measurement techniques are listed in alphabetical order (with some exceptions
where similar techniques are grouped together). Included under each technique are the nano-object
parameters that can be measured by the technique and a listing of the technique’s advantages, limitations,
measurands, and relevant standards. Generally, a single technique cannot provide characterization of all nano-
object parameters of interest. Also, a technique can be useful to determine other parameters not listed. For
comprehensive analysis of a single parameter, use of multiple techniques, where applicable, is highly
recommended.
Sometimes multiple techniques share a similar underlying theory of operation or physical phenomenon, but
have differences that make them uniquely applicable to different types of materials and measurement
conditions. For example, different electromagnetic scattering techniques are better suited for the analysis of
different materials (e.g. metals, polymers or refractories) or materials in different states (e.g. suspended in a
liquid or incorporated into a solid matrix). Other resources exist to help evaluate the measurands given by a
given measurement technique. For example, understanding the different resulting diameters given by a
measurement technique, couldcan require the use of additional resources.
5.2 Acoustic spectroscopy (AS)
5.2.1 Description
The basic concept of acoustic methods is to measure the frequency-dependent attenuation or velocity of
ultrasound as it propagates through a heterogeneous sample, e.g. colloids, dispersions and emulsions.
Both acoustic and electroacoustic spectroscopies are linked to a sound propagation through a heterogeneous
system such as a suspension or an emulsion. An acoustic spectrometer measures only the changes in the
properties of the sound wave, whereas an electroacoustic spectrometer deals with connection between
electrodynamic phenomena and the sound wave pressure field. Acoustic and electroacoustic spectroscopies
are independent methods because the attenuation has little effect on the electroacoustic spectra and
conversely, electrokinetic phenomena have negligible effect on the attenuation spectra.
© ISO 2026 – All rights reserved
ISO /DTS 18196:2026(E:(en)
5.2.2 Nano-object parameters
The nano-object parameters are concentration, size and size distribution.
5.2.3 Advantages
Advantages of acoustic spectroscopy include:
— - Does not require sample dilution; applicable for concentrated samples.
— - Method is suitable for characterizing aggregated and structured systems.
— - Measurement is not affected by stirring and/or pumping of the sample.
— - Absolute method; does not require size calibration.
— - Instrument verification can be conducted by measurement of water with known acoustic properties.
— - Solvent-based samples (non-aqueous) can be analysed.
5.2.4 Limitations
Limitations of acoustic spectroscopy include:
— - Applicable only to liquid-borne particles.
— - Lower size limit ≈approximately 10 nm; upper size limit ≈approximately 3 mm.
— - Lower volume fraction limit is ≈approximately 0,1 %; upper volume fraction limit is ≈approximately
50 %.
5.2.5 Measurand
Equivalent spherical particle size distribution on a volume basis calculated from the ultrasound attenuation
frequency spectrum.
5.2.6 Relevant standards
Relevant standards include ISO 20998-1 and ISO 20998-2.
5.3 Analytical centrifugation (AC)/Liquid sedimentation techniques (AUC/CLS/DCS)
5.3.1 Description
Analytical centrifugation (AC) is chosen here as the generic term for several centrifugal sedimentation
techniques, (some of which are) also known as centrifugal liquid sedimentation (CLS), analytical
ultracentrifugation (AUC) or differential centrifugal sedimentation (DCS). It is applicable for suspensions and
emulsions. Together, this is a versatile family of methods for the characterisation of particles in the size range
of typically 10 nm to 10 µm. They all employ centrifugal fields (acceleration 10 × g to 500 000 × g; rotor speed
100 r/min to 60 000 r/min) to induce a migratory motion, i.e. centrifugal sedimentation, of particles in a liquid
medium of different density. The sedimentation velocity is proportional to the squared particle size, for which
reason centrifugation does not only cause a separation between the dispersed and continuous phase, but also
a separation into different size fractions. AC techniques monitor this process via measurements of refractive
index, extinction or scattering of light (UV/VIS/NIR) or attenuation of X-rays. The time curves or radial profiles
of such signals can be used to quantify each fraction of sedimentation velocity or equally to determine the
distributions of the sedimentation coefficient (i.e. ratio of sedimentation velocity to centrifugal acceleration)
© ISO 2026 – All rights reserved
ISO /DTS 18196:2026(E:(en)
and the equivalent particle size (Stokes diameter). In the case of isolated nano-objects considerably smaller
than 100 nm, a rigorous analysis facilitates calculation of particle size and the additional determination of
particles’ buoyant density or their shape factor. The resolution of AC methods is relatively high due to the
physical separation of particle fractions.
5.3.2 Nano-object parameters
Size distribution (Stokes diameter), additionally distribution of buoyant density or diffusion coefficient or
shape factor.
5.3.3 Advantages
Advantages of AC/AUC/CLS/DCS include:
— -High size resolution depends on the instrumentation (beam width, sedimentation distance for detector
position, noise, optical properties and density of particles) and data analysis (noise handling). Smallest
meaningful ratio of upper to lower limit of size classes maycan be in the range of 1.,01 to 1.,05.
— -Broad size range, typically 10 nm-10 µm (dependent on material and instrumentation: down to 1 nm).
5.3.4 Limitations
A limitation of AC/AUC/CLS/DCS is that the AC particle size distribution method can give spurious results if
particle size is too high, i.e. if the particles form a sediment too quickly or if they display a broad chemical
heterogeneity (i.e. no uniform particle density).
5.3.5 Measurand
The measurands for of AC/AUC/CLS/DCS include:
— -Sedimentation velocity in centrifugal field, in dependence on acceleration. Sedimentation coefficient (in
particular for dissolved polymers, proteins, soft particles; depends on the dispersion medium).
— -Stokes diameter (equivalent diameter for sedimentation velocity; independent of the dispersion
medium).
— -Refractive index, extinction or scattering of light (UV/VIS/NIR) or attenuation of X-rays.
5.3.6 Relevant standards
Relevant standards include ISO 13318-1, ISO 13318-2, ISO 13318-3, ISO 18747, and ISO 20427.
5.4 Atomic force microscopy (AFM)
5.4.1 Description
AFM is the most commonly used technique in the scanning probe microscopy (SPM) family for measuring
topographic information. AFM is a technique for imaging surfaces by measuring the interactions between a
tip and the surface. The tip is generally attached to a cantilever and, by scanning the tip along the surface, it is
possible to obtain topographic images with nanoscale resolution. AFM can be operated in two distinct modes,
the static mode (also known as contact mode) and the dynamic one (tapping and non-contact modes). In both
operational modes, the cantilever´s deflection or vibrational amplitude/frequency reflect the sensed forces
between the tip and the surface, resulting in a topographical map of the surface.
© ISO 2026 – All rights reserved
ISO /DTS 18196:2026(E:(en)
For the most common measurands when analysing nano-objects are size and shape; however, it is also
possible to measure additional properties such as electrical conductivity, magnetic domains, mechanical and
tribological properties and thermal measurements.
Other members of the SPM family include Scanning Tunnelling Microscopyscanning tunnelling microscopy
(STM) and Scanning Nearscanning near field Optical Microscopyoptical microscopy (SNOM). Scanning
tunnelling microscopy (STM) measures a weak electrical current flowing between tip and sample as they are
held a very small distance apart. It is used for imaging conductive surfaces by mechanically scanning a sharp,
voltage-biased, conducting probe tip over their surface, in which the tunnelling current and the tip-surface
separation are used to generate the image.
SNOM is a method of imaging surfaces optically in transmission or reflection by mechanically scanning an
optically active probe much smaller than the wavelength of light over the surface while monitoring the
transmitted or reflected light or an associated signal in the near-field regime. Here, the optical active probe is
an aperture through which the light passes or an apertureless probe which is typically an illuminated sharp
metal or metal-coated tip.
5.4.2 Nano-object parameters
The nano-object parameters include size, size distribution and shape.
5.4.3 Advantages
Advantages of AFM include:
— -Direct topographic information from the sample surface.
— -Sample morphology can be correlated with mechanical, electrical, magnetic, and some chemical
composition.-Measurements can be made in vacuum, liquid, air or a controlled atmosphere including
temperature and humidity.
— -Minimal sample preparation.
— -Can be calibrated to obtain length measurements traceable to the SI unit.
5.4.4 Limitations
Limitations of AFM include:
— -Scanning speed determines the measurement time.
— -Sample immobilization might be required for nano-sized objects.
— -Deconvolution required for accurate width measurements below ≈approximately 50 nm. However, if the
size measurement is based on z-displacement (height measurements), then tip convolution effects are not
relevant.
— -Agglomeration of nano-objects can occur during sample preparation.
5.4.5 Measurand
Measurands of AFM include height and depth of the sample. Length and width measurements are possible but
limited due to the tip size.
© ISO 2026 – All rights reserved
ISO /DTS 18196:2026(E:(en)
5.4.6 Relevant standards
Relevant standards include: ISO 11039, ASTM E 2859-11, ISO 18115-2, ISO 11952: 2019 and ASTM E2382:
2004 (2012).
—
5.5 Auger electron spectroscopy (AES)
5.5.1 Description
Auger electron spectroscopy (AES) is an electron beam technique that is commonly used to determine the
chemical composition of surfaces. Excitation of the sample with an energetic electron beam results in the
generation of a core hole. Relaxation from this excited state occurs when this core hole is filled by an electron
from a higher energy state with the simultaneous emission of either an X-ray photon or an Auger electron. Due
to the relatively low energies (<3 keV) of the emitted Auger electrons, their mean free path within the sample
is limited to less than 10 nm, making AES inherently surface sensitive.
5.5.2 Nano-object parameters
Concentration (secondary electron imaging or elemental mapping), size (secondary electron imaging or
elemental mapping), chemical composition and shape.
5.5.3 Advantages
Advantages of AES include:
— -High spatial (<1 μm) and surface (≈(approximately 0,1 nm) resolution -spatial in this context refers to
horizontal plane of analysis (x-y direction) and surface refers to depth.
— -Elemental mapping possible when employing a scanning electron beam.
— -Depth profiling capability when combined with ion sputtering.
— - High detection sensitivity; capable of analysing a fraction of a surface monolayer.
5.5.4 Limitations
Limitations of AES include:
— -Analysis of non-conducting samples can be problematic due to surface charging effect.
— - Surface contamination can complicate data analysis.
5.5.5 Measurand
Measurands include
— Electron energies (eV) and signal intensity (counts).
— Length and width (Å or nm) measured from secondary electron image or elemental mapping.
— Depth (Å or nm) using ion sputtering and measured against a standard of known thickness.
© ISO 2026 – All rights reserved
ISO /DTS 18196:2026(E:(en)
5.5.6 Relevant standards
Relevant standards include: ISO 16531, ISO 20903, ISO/TR 14187, ASTM E827-08, ASTM E984-12,
ASTM E996-10 and ASTM E1217-11.
5.6 Brunauer-Emmett-Teller (BET) method for physical adsorption — Surface area
determination
5.6.1 Description
A technique for the determination of the total specific surface area of finely divided and porous solids by
measuring the amount of physically adsorbed gas utilizing the model developed by Brunauer, Emmet and
[27] [27]
Teller for interpreting gas adsorption isotherms. .
BET is applicable only to adsorption isotherms of type II (nonporous or macroporous solids) and type IV
(mesoporous solids) according to the IUPAC classification of adsorption isotherms. For these cases, the BET
area can be regarded as the “probe accessible area” (i.e. the effective area available for the adsorption of the
chosen adsorptive).
Typically, high purity N gas is utilized at 77 K (temperature of liquid N ). For materials with very low specific
2 2
surface area (less than about 1 m /g), krypton at 77 K can be used in place of N .
5.6.2 Nano-object parameters
The nano-object parameters are specific surface area and pore volume.
5.6.3 Advantages
The advantages of BET are:
— -Well-defined techniques and ISO standards available.
— - Automated analysis.
— - High precision.
5.6.4 Limitations
The limitations of BET are:
— -The method is generally restricted to dry powders and porous solids.
— - Prior to analysis, the sample is usually outgassed (aggregation might occur) at elevated temperatures.
— - The BET method cannot reliably be applied to solids which absorb the measuring gas.
5.6.5 Measurand
2 -1
The measurand is specific surface area in m g .
5.6.6 Relevant standards
The relevant standards include: ISO 9277, ISO 15901--2, ISO 18757, ASTM C1274-12, ASTM D 1993-03,
ASTM B922-10, and ASTM C1069-09.
© ISO 2026 – All rights reserved
ISO /DTS 18196:2026(E:(en)
5.7 Condensation particle counter (CPC)
5.7.1 Description
A condensation particle counter (CPC) measures and counts the number of nanoparticles in a vapor stream.
The common principle of all different CPC types is that condensation of supersaturated vapours is used to
grow particles to droplets of sizes that can be detected optically. This increases the ability for CPCs to detect
the particles with accuracy,.
5.7.2 Nano-object parameters
The nano-object parameter for CPC is concentration.
5.7.3 Advantages
The advantages of CPC are:
— Real-time measurement.
— Capable of time-dependent measurement.
— Well-established quality assurance procedures.
— Measurement is generally independent of particle properties over a wide size range.
— Low concentration capability, i.e. able to measure very low particle number concentrations.
— CPCs exist with butanol, isopropanol and water as working fluids.
5.7.4 Limitations
The limitations of CPC are:
— Applicable only to airborne nanoparticles.
— Lower size limit ≈approximately 1 nm; upper size limit ≈approximately 5 μm.
— Upper number concentration limit subject to the onset of coincidence.
— Lower size limit is dependent on particle composition.
5.7.5 Measurand
The measurand of CPC is particle number concentration.
5.7.6 Relevant standards
The relevant standards for CPC include: ISO 27891.
—
5.8 Differential mobility analysis system (DMAS)
5.8.1 Description
[35] [35]
A technique to measure the size distribution of submicrometre aerosols .
© ISO 2026 – All rights reserved
ISO /DTS 18196:2026(E:(en)
The differential mobility analysis system (DMAS) consists of charge neutralization, differential electrical
mobility classifier (DEMC), particle detector, plumbing, pump and electronics. The DEMC consists of a channel
with an opening in the wall at a downstream location perpendicular to the flow. An aerosol with a Fuchs charge
distribution flows down the channel with a DC voltage applied to the walls of the channel. The applied voltage
gradient will cause the charged particles to drift with a migration velocity according to the mobility of the
particle to the wall with the opening. The size of the particles classified by passing through the side wall
opening depends on the particle size, particle charge, voltage gradient, width of the channel, length along the
[36] [36]
channel to the opening and flow velocity . This is a first principles measurement.
A condensation particle counter (CPC) is one possible particle detector suitable for use with a differential
mobility analysis system. The common principle of CPC instrument types is that condensation of
supersaturated vapour is used to grow ultra-fine and nanoparticles to droplets of sizes that can be detected
optically. A CPC does not discriminate by size; it is a detector that provides a count of particles within the
operational size range over a period of time. If coupled with a size classifier, then the combination technique
can provide a number size distribution.
5.8.2 Nano-object parameters
The nano-object parameters include concentration, size and size distribution. Note that theThe size is an
electrical mobility equivalent diameter (i.e., diameter of a sphere having the same electrical mobility as the
target particle).
5.8.3 Advantages
The advantages of DMAS are:
— High size resolution (<2 % uncertainty at 2,5 nm for commercial instruments) for high sheath air to
sample ratio.
— No size distribution assumptions required.
— Near real-time measurement.
— Capable of time-dependent measurement.
— Well-established quality assurance procedures.
5.8.4 Limitations
The limitations of DMAS are:
— Applicable only to airborne nanoparticles (suspensions or powders are required to be aerosolized). Note
that an electrospray device is commonly used in conjunction with a DMAS to generate predominantly
singly-charged aerosolized material from a particle suspension.
— Lower size limit typically ≈approximately 2 nm (commercial high flow DEMCs exist, that would allow to
extend the lower size limit to below 1 nm); upper size limit ≈approximately 1 000 nm.
−3
— Lower number concentration limit ≈approximately 1 cm ; upper number concentration limit
7 −3
≈approximately 10 cm (without dilution). At small sizes the lower concentration limit is higher than
-3
1 cm . Uncertainties increase for small sizes due to the charge distribution correction.
5.8.5 Measurand
The measurands is particle number concentration as function of electrical mobility equivalent diameter.
© ISO 2026 – All rights reserved
ISO /DTS 18196:2026(E:(en)
5.8.6 Relevant standards
The relevant standards include ISO 15900 and ISO 28439.
5.9 Differential scanning calorimetry (DSC)
5.9.1 Description
A technique in which the difference in the energy inputs into a substance and a reference material is measured
as a function of temperature while the substance and reference material are subjected to a controlled
temperature program.
5.9.2 Nano-object parameters
The nano-object parameters include physical changes such as glass transitions, crystallization and oxidation.
5.9.3 Advantages
The advantages of DSC include:
— Minimal sample preparation required.
— Fast scanning can allow for suppression of material decomposition at higher temperatures (scan at
400 °C/min and faster).
— Wide temperature ranges.
— Measurements can be conducted in different atmospheres.
— Can characterize qualitative bond strength between nano-filler and epoxy in nanocomposites (strong or
[38][39] [38][39]
weak) and examines rigid amorphous fraction (RAF) of nanocomposite system .
— Can be used with secondary detection techniques, such as FTIR or mass spectrometry, to get additional
chemical information about the material.
5.9.4 Limitations
The limitations of DSC include:
-1
— Many DSC instruments cannot scan at 400 °C min or collect data at those speeds.
— DCS is a destructive measurement technique.
5.9.5 Measurand
The measurands include:
— Energy input per mass in endothermic or exothermic reactions.
— Heat capacity, specific heat.
5.9.6 Relevant standards
The relevant standards include ISO 11357--1, ISO 11357--2, ISO 11357--3, ISO 11357--4, ISO 11357--5,
ISO 11357--6, and ISO 11357--7.
© ISO 2026 – All rights reserved
ISO /DTS 18196:2026(E:(en)
5.10 Dynamic light scattering (DLS)
5.10.1 Description
DLS, also referred to as quasi-elastic light scattering (QELS), is an ensemble technique for measuring the size
of particles undergoing Brownian (random translational) motion in liquid suspension. DLS includes photon
correlation spectroscopy (PCS), photon cross-correlation spectroscopy (PCCS) and frequency analysis,
although PCS is by far the most common sub-technique. The random translational motion of the particles
results in a fluctuating photon count rate measured over very small increments of time (order of
microseconds) and a small shift in the frequency of light. The rate of fluctuation or the magnitude of the
frequency shift is therefore related to the particle motion, which is related to the particle’s hydrodynamic size.
Correlation analysis of the time-dependent intensity of the scattered light, or analysis of the frequency shift of
the scattered light in frequency domain, can yield the translational diffusion coefficient and hence the
equivalent spherical hydrodynamic diameter via the Stokes-Einstein relationship.
The optical setup for depolarized dynamic light scattering (DDLS) is essentially the same as that for standard
DLS, with the key modification being the addition of a depolarizer (polarization filter) before the detector. In
DDLS measurements, correlation functions can be simultaneously extracted for both polarized and
depolarized components of scattered light. In this way, the observed decay rate (Γ) is related to both the
translational and rotational diffusion coefficients of an optically anisotropic (e.g. rod-like) structure. Particles
th
power.
smaller than approximately 100 nm scatter light proportional to their radius raised to the 6
Generally, larger particles contribute substantially more to the scattering signal compared with smaller
particles. Therefore intensity-weighted size distributions calculated from DLS will be biased toward larger
particles in a polydisperse population.
In standard DLS measurements, scattering is polarized parallel to the incident beam, whereas the scattered
light polarized perpendicular to the incident beam provides the dynamic form factor for anisotropic scatterers.
By analysing this phenomenon, the aspect ratio or asymmetry of the structure can be determined. As in any
DLS measurement, polydispersity (in this case with respect to anisometry or rod length, e.g.) will complicate
the analysis. Measuring changes in the depolarization of scattered light yields information on the changes in
size and shape of the scattering particles.
5.10.2 Nano-object parameters
The nano-object parameters include size, size distribution (polydispe
...